
Summary bucket thresholds and units depend on the configured LIMIT options and documented boundaries. Do not assume universal defaults. Verify the actual logging rule before interpreting buckets; no logging rules were changed by this audit.
Lab check: 24 October 2026 · Teradata 20.00.28.81 · BTEQ 20.00.00.11 · BTET. Only the dictionary query shapes below were tested, using zero-row predicates. No production logs were read, no rules were enabled and no log-delivery or performance-overhead claim was tested. Download the SQL and observed results.
Verify the available DBQL columns without exposing query text
SELECT StartTime, QueryID, UserName, ErrorCode, AMPCPUTime, TotalIOCount
FROM DBC.QryLogV WHERE 1=0;
SELECT * FROM DBC.DBQLRulesV WHERE 1=0;
Both probes completed with zero rows as intended. They establish that these columns/views were available to the lab administrator. For actual analysis, use authorized filters for the relevant user and time range, and inspect the applicable logging rules. Zero rows from these probes say nothing about whether requests were logged.
Correction: WITH NONE disables logging for its matching scope; it does not log every request. Full SQL/object logging also has storage, workload and sensitive-data implications. Choose scope and retention with the DBA and measure overhead.
Reference: Teradata WITH logging options.
What is Query Logging with Teradata DBQL Tables?
Query Logging is a feature that allows us to analyze workload and resource usage and perform performance tuning.
How Is Query Logging Implemented?
The Query Logging Framework comprises a set of DBC tables known as the Teradata DBQL tables, storing performance indicators for groups of requests and request steps. By configuring the settings, we can select which key figures to store and their level of detail.
Does the information in the DBQL tables represent 100% of the workload of a Teradata system?
No, because we can define which information should be stored and in which detail, as mentioned above. We can use filters for logging only the required information. Detailed information can be aggregated and is then only available in aggregated form.
For performance reasons, the collected information is not real-time in the DBQL tables but is cached in memory and written at intervals (e.g., every 10 minutes). If the system restarts, all information not yet written from the cache to the DBQL tables is lost.
The DBSControl option “DBQLFlushRate” controls in which intervals the cache is written to the DBQL tables.
If we want to write the cache immediately, we can do it with the following command:
FLUSH QUERY LOGGING WITH ALL;
How is it determined how much information about which objects should be collected?
The following commands control query logging:
BEGIN QUERY LOGGING / END QUERY LOGGING
Teradata stores the precise logging rules in view DBC.DBQLRulesV.
How can I determine which rules are activated?
One way is by using this command:
SHOW QUERY LOGGING ON ALL;
Rule UserName “ALL” (From an ALL rule)
Rule UserId 00000000
Rule ZoneId FFFFFFFF
Account (Rule for any Account)
WITH NONE (No DBQL Logging)
Another possibility is to query the table with the rules:
SELECT * FROM DBC.DBQLRulesV;

Which users can enable or disable DBQL?
Only those who have EXECUTE permissions on the following macro:
GRANT EXECUTE ON DBC.DBQLAccessMacro TO DWHPRO;
Which DBQL tables should we permanently activate?
Choose SQL/object logging scope, retention and access with the DBA. A valid scoped template is BEGIN QUERY LOGGING WITH SQL, OBJECTS LIMIT SQLTEXT=0 ON DWHPRO; Logging overhead depends on the workload and selected detail; no logging rules were changed or overhead measured in this audit.
How should Query Logging for Tactical Queries be done?
A high CPU/I/O ratio or I/O count is a diagnostic observation, not proof of table replication. MVC encodes selected column values, while BLC compresses blocks; they are separate mechanisms. Inspect plan steps and runtime metrics before inferring a cause. 
The Teradata DBQL Tables
The DBC database contains several table/view combinations for query logging.
Get the complete Teradata tuning book, free
Teradata Query Performance Tuning: The DWHPro Guide
By Roland Wenzlofsky & Artemios Vogiatzis
206 pages on statistics and demographics, access paths and indexes, query execution plans, and joins. Get the full PDF and practical Teradata updates from DWHPro.
Confirm your email to receive your download link. Privacy policy. Unsubscribe in any newsletter.
About the free bookWatch: why a request is missing from DBQL
This video walks through the question at the end of this article: why a completed request is missing from DBQL, with the four checks and the read-only probes shown above.
- DBC.DBQLOGTBL and DBC.QryLogV
The table DBC.DBQLOGTBL stores one row per query with aggregated key figures like the number of CPU seconds, the number of IOs, and much more. - DBC.DBQLStepTbl and DBC.QryLogStepsV
The individual query steps are saved here, including the important key figures for each query system. - DBC.DBQLObjTbl and DBC.QryLogObjectsV
One row per database object used is stored here. - DBC.DBQLSqlTbl and DBC.QryLogSQLV
All SQL text is stored here in the common record for table DBC.DBQLOGTBL. One SQL text may require several rows per query. - Summary bucket thresholds and units depend on the configured LIMIT options and documented boundaries. Do not assume universal defaults. Verify the actual logging rule before interpreting buckets; no logging rules were changed by this audit.
- DBC.DBQLExplainTbl and DBC.QryLogExplainV
Saves the individual steps of the Execution Plan - DBC.DBQLXMLTbl and DBC.QryLogXMLV
Saves the Execution Plan of the queries as XML - DBC.QryLogEventsV
Stores workload management events - DBC.QryLogExceptionsV
Stores workload management exceptions
Teradata DBQL Logging Levels
Teradata query logging can be enabled for all or selected users.
BEGIN QUERY LOGGING ON ALL;
BEGIN QUERY LOGGING ON DWHPRO;
We can restrict query logging to an account or a particular account and user combination.
BEGIN QUERY LOGGING ON DWHPRO ACCOUNT = 'TheAccount';Logging can be constrained to particular Teradata applications.
BEGIN QUERY LOGGING ON APPLNAME = 'Application';The WITH Option
WITH selects logging detail and belongs before LIMIT/ON, for example BEGIN QUERY LOGGING WITH SQL ON DWHPRO;. Treat this as an administrative template requiring an authorized logging scope.
- NONE
Turn off query logging for the specific user, account, or application - ALL
Log DBC.DBQLOGTBL plus EXPLAIN, OBJECTS, SQL, STEPINFO - EXPLAIN
Log DBC.DBQLOGTBL plus the EXPLAIN text - OBJECTS
Log DBC.DBQLOGTBL plus the objects accessed - SQL
Log DBC.DBQLOGTBL plus the entire SQL text - STEPINFO
Log DBC.DBQLOGTBL plus all steps of the query - XMLPLAN
Log DBC.DBQLOGTBL plus the Explain Plan as XML - STATSUSAGE
Log DBC.DBQLOGTBL plus statistics usage
The LIMIT Option
The LIMIT parameter dictates the amount of data that is retained.
- SQLTEXT
Determines the length of the SQL text which is stored. The default is 200 characters. It can be between 0 and 10,000 characters. - Summary bucket thresholds and units depend on the configured LIMIT options and documented boundaries. Do not assume universal defaults. Verify the actual logging rule before interpreting buckets; no logging rules were changed by this audit.
- Summary bucket thresholds and units depend on the configured LIMIT options and documented boundaries. Do not assume universal defaults. Verify the actual logging rule before interpreting buckets; no logging rules were changed by this audit.
Difference Between SUMMARY And THRESHOLD
Both logging types can utilize extra filters such as seconds, milliseconds, CPU and normalized CPU milliseconds, and the number of IOs.
Summary bucket thresholds and units depend on the configured LIMIT options and documented boundaries. Do not assume universal defaults. Verify the actual logging rule before interpreting buckets; no logging rules were changed by this audit.
THRESHOLD = n [ELAPSEDSEC, ELAPSEDTIME, CPUTIME, CPUTIMENORM or IOCOUNT]
Query Logging Examples
- Illustrative historical bucket 1: interpret its boundary from the configured rule.
- Illustrative historical bucket 2: units and inclusivity depend on the configured rule.
- Illustrative historical bucket 3: check the configured threshold.
- Illustrative historical final bucket: requests above the configured threshold.
BEGIN QUERY LOGGING LIMIT THRESHOLD = 100 IOCOUNT ON ALL;The Teradata DBQL Table Key Figures
The figures below are vital for optimizing queries through DBQL:
- Query Start Time and Query End Time
- Parsing Time of the Query
- Error Codes
- Total CPU Time (check the units for the specific DBQL column)
- Total IO Count
- Workload Delay Times
- The Query Text (truncated)
Performance indicators can be found in the DBQLOGTBL table, whose contents depend on the logging rules configured for the system. It is often the only means of identifying metrics.
We use the DBQLStepTbl to obtain comprehensive and detailed data for each query step.
- Query Step Timings (Start and End Time of each step)
- Row Counts per Step
- The activity of each Step (Join, Redistribution, etc.)
- CPU and IO usage for each step
Access more information on Teradata DBQL through the official documentation by clicking the link provided: Teradata Official Documentation for DBQL.
What Are The Most Useful DBQL Performance Indicators?
The Teradata Performance Indicators provide diverse viewpoints of a query and an overview of its potential for enhancement. Access these indicators via the DBC.DBQLOGTBL table.
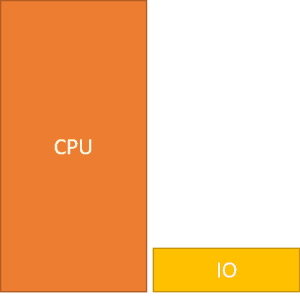
The DBQL Product Join Indicator
This indicator can detect undesired product joins, as implied by its name.
The product joins are identified by analyzing the CPU to I/O ratio. A high ratio is a diagnostic clue, not proof of a product join. CPU-heavy in-memory work and other operations can produce a high ratio; confirm the join in EXPLAIN or step evidence. You can use the following formula to calculate the indicator:
CASE WHEN TotalIOCount = 0 THEN 0 ELSE (AMPCPUTime * 1000)/TotalIOCount ENDIf the product join indicator exceeds 3, the execution plan for product joins should be examined.
A high product join indicator value can be attributed to other factors, such as:
- Aggregations of large amounts of data that pass through the memory. Since the aggregation occurs in memory, hardly any IOs are required but many CPU seconds.
- Duplicate rows check when there are a lot of hash collisions.
- Extensive string operations – often generated in the automatically generated queries of BI tools.
- MVC can place more logical values into fewer stored bytes and may reduce I/O; this does not require a statement about BLC hardware. BLC is a separate block-compression mechanism whose CPU and I/O tradeoffs depend on algorithm, acceleration and workload. Neither mechanism guarantees a particular CPU-to-I/O ratio.
The DBQL Indicator For Wasted I/Os
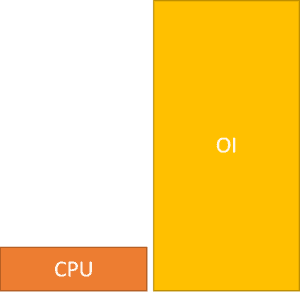
A high I/O-to-CPU ratio is not proof of table replication. Correlate it with actual plan steps, row counts and data movement before inferring a cause.
Below is the formula for the indicator:
CASE WHEN AMPCPUTime = 0 THEN 0 ELSE TotalIOCount/(AMPCPUTime * 1000) ENDSimilar to the product join indicator, it is crucial to inspect the execution plan when the value exceeds 3.
The DBQL CPU and IO Skew Indicators
The skew indicator is crucial in detecting imbalanced workloads that result in subpar performance on Teradata systems. It analyzes tables, joins, spools, and other potential causes of skewness.
To calculate CPU skew, use the following formula:
CAST(MaxAmpCPUTime AS FLOAT) * (HASHAMP()+1)
  / NULLIFZERO(AMPCPUTime)
To compute I/O skew, follow these steps:
CAST(MaxAmpIO AS FLOAT) * (HASHAMP()+1)
  / NULLIFZERO(TotalIOCount)
These expressions compare the maximum AMP value with an average under the assumed AMP count. HASHAMP()+1 is a map/topology assumption, not the request’s measured participating-AMP count. Verify the relevant map and replace the count when the request uses a subset or another map. NULLIFZERO returns NULL when the total is zero; a skew factor is undefined in that case. A factor of 2 means the maximum is twice the assumed average, not a universal tuning threshold.
The DBQL CPU Impact Indicator
This indicator measures the effect of skew on system parallelism utilization.
We calculate the indicator using the following method:
MaxAmpCPUTime * (HASHAMP()+1)This estimate depends on workload size, the maximum AMP CPU and the assumed AMP count. A larger value alone does not establish that a query is worse; compare equivalent work and confirm the participating-AMP assumption.
DBQL Indicator Summary
Use these indicators alongside input cardinality, actual step evidence and comparable workload conditions. The same plan can produce different resource use when data volume, skew or concurrency changes.
DBQL Query Response Times
Elapsed time is an important outcome but includes effects such as concurrency, queueing and cache state. Compare repeated runs under documented conditions and inspect CPU, I/O and step evidence before attributing a runtime change to a SQL rewrite.
DBQL tells you what ran; two other tools tell you how: reading an EXPLAIN plan and how utility work is classified.
For the monitoring layer on top of the logs: what Viewpoint shows that DBQL does not.
Two more administration subjects: tagging sessions with a query band and running Teradata Express under Proxmox.
The tables and objects behind the logging: what each DBQL table actually holds, logging utility runs separately and granting rights through roles rather than users.
Why is a completed request missing from DBQL?
- Check the matching rule and whether a more specific rule changes the scope or disables logging with WITH NONE.
- Summary bucket thresholds and units depend on the configured LIMIT options and documented boundaries. Do not assume universal defaults. Verify the actual logging rule before interpreting buckets; no logging rules were changed by this audit.
- Allow for the configured cache-flush delay, and check the queried time range and retention.
- Verify the request’s user, account and application identity and your access to the relevant log view.
Do not enable unrestricted SQL capture simply to make a test visible. A DBA can choose narrow diagnostic coverage and a retention policy. SQL text can contain sensitive literals.
Does a high CPU-to-I/O ratio prove a product join?
No. Treat the ratio as a prompt to inspect EXPLAIN and actual step evidence. In-memory aggregation and other CPU-heavy work can also produce a high value. Plan estimates are not measured resource consumption, and missing step logs are not proof of zero work.
Skew-expression verification, 24 October 2026: the corrected CPU/I/O expressions compiled against DBC.QryLogV with a zero-row predicate. Synthetic four-AMP arithmetic returned factors of 2 and NULL for a zero denominator. This validates syntax and arithmetic, not the AMP-count assumption for a real request. Download the skew-expression checks and results.
Need help with query performance or platform costs?
Diagnose plans, skew, spool pressure and expensive workloads. Agree a baseline and acceptance criteria before making changes.
Get the complete Teradata tuning book, free
Teradata Query Performance Tuning: The DWHPro Guide
By Roland Wenzlofsky & Artemios Vogiatzis
206 pages on statistics and demographics, access paths and indexes, query execution plans, and joins. Get the full PDF and practical Teradata updates from DWHPro.
Confirm your email to receive your download link. Privacy policy. Unsubscribe in any newsletter.
About the free book
How do I export logs from Teradata to external system?Is there any method to do that ? if we can do it using teradata viewpoint please explain the procedure
Hi,
in the official VM I was not able to enable the logging in Teradata Studio Express, I go the error:
Executed as Single statement. Failed [9944 : HY000] DBQL Statements not allowed inside ANSI transactions and explicit Teradata (BTET) transactions.
The solution is to change the JDBC connection properties, TMODE=TERA
br
Fari