To gain a comprehensive insight into the operation and performance of your load utilities and DSA jobs, the DBQLogTbl offers a starting point.
The DBQLogTbl provides metrics for these utilities, but they are not as accurate or plentiful as those provided by Teradata DBQLUtilityTbl.
What is the Teradata DBQL Utility Log?
The DBQLUtilityTbl offers a wealth of information, such as timestamps for various stages of utility jobs (acquisition and application for FastLoad/MultiLoad/MLoadX utility protocols, selection and export steps for the export utility), as well as for DSA jobs’ dictionary-data-build-postscript phase. It also provides details on logical and physical IO usage and CPU time.
Logging utility jobs provides valuable insights for performance analysis, including data volume, delay duration, and phase duration. Archiving these logs allows for a substantial history to identify patterns and tendencies, enabling informed decisions on potential enhancements.
To begin, the user running the utilities must have a specific logging level.
BEGIN QUERY LOGGING ON SYSPROD WITH UTILITYINFO;This logging level is extensive as there is no provision to set a CPU threshold for this user, resulting in logging all activities.
This is significant to take note of because:
- Your DBQL reports on the activity for this particular user (or in general) can potentially skyrocket (especially query counts)
- The amount of data you are storing will increase since more data is logged
The DBQLUtilityTbl has 129 columns, and its corresponding view is QryLogUtilityV.
How to use the Teradata DBQL Utility Log
This SQL query can help to narrow down the information:
SELECT

CAST (StartTime AS DATE) logdate
,USERNAME
,sessionid
,UtilityName

/*if you have querybands defined in your utility jobs, it is a good idea to extract this information*/
,GETQUERYBANDVALUE(queryband, 0, 'JobName') AS JobName
,GETQUERYBANDVALUE(queryband, 0, 'UtilityDataSize') AS UtilityDataSize
,GETQUERYBANDVALUE(queryband, 0, 'ClientLoadSessions') AS RequestSession  /*utility jobs can define a min and max sessions in their script*/

, NumSesOrBuildProc AS "GrantedSession" /*if you're using tasm workload management, what is allocated is not what is requested in the tpt script, but what is defaulted in tasm (if no utilitydatasize is defined in the queryband)*/

,EXTRACT ( HOUR   FROM Phase0StartTime ) AS hh
,EXTRACT ( MINUTE FROM Phase0StartTime ) AS mm
,jobstarttime AT TIME ZONE 'Europe Central' AS StartTime
,jobendtime AT TIME ZONE 'Europe Central' AS EndTime

/*this total elapsed time includes the time it spent waiting for a utility slot (waiting in delay state)*/
,((EndTime - StartTime) HOUR(4) TO SECOND) AS TotElapsedTime

/*easier to work with this format when graphing the data into excel*/
,CAST ( ( EXTRACT ( HOUR FROM TotElapsedTime) * 3600 + EXTRACT ( MINUTE FROM TotElapsedTime) * 60 + EXTRACT ( SECOND FROM TotElapsedTime) ) AS  DEC (10,2)) AS TotElapsedTime_sec
,CAST ( ( EXTRACT ( HOUR FROM TotElapsedTime) * 3600 + EXTRACT ( MINUTE FROM TotElapsedTime) * 60 + EXTRACT ( SECOND FROM TotElapsedTime) ) / 60.00 AS  DEC (10,2)) AS TotElapsedTime_min

/*actual elapsed time*/
,CAST ( ( EXTRACT ( HOUR FROM TotElapsedTime) * 3600 + EXTRACT ( MINUTE FROM TotElapsedTime) * 60 + EXTRACT ( SECOND FROM TotElapsedTime) ) - DelayTime AS DEC (10,2)) AS ActElapsedTime_sec
,CAST ( ( EXTRACT ( HOUR FROM TotElapsedTime) * 3600 + EXTRACT ( MINUTE FROM TotElapsedTime) * 60 + EXTRACT ( SECOND FROM TotElapsedTime) ) - DelayTime  / 60.00 AS DEC (10,2)) AS ActElapsedTime_min
,CASE WHEN DelayTime IS NULL THEN 0 ELSE DelayTime END AS DelayTime

/*phase1*/
, CAST ( EXTRACT(HOUR FROM ((phase1endtime - phase1starttime) HOUR TO SECOND)) * 3600 +
EXTRACT(MINUTE FROM ((phase1endtime - phase1starttime) HOUR TO SECOND)) * 60 +
EXTRACT(SECOND FROM ((phase1endtime - phase1starttime) HOUR TO SECOND)) AS DEC (10,2)) AS Phase1ElapsedTime
,CAST ( Phase1RowCount AS INT )
,CAST ( Phase2RowCount AS INT )
,CAST ( RowsInserted AS INT )
,CAST ( (Phase1RowCount - RowsInserted)  AS INT ) AS RowsRejected

/*phase2*/
, CAST ( EXTRACT(HOUR FROM ((phase2endtime - phase2starttime) HOUR TO SECOND)) * 3600 +
EXTRACT(MINUTE FROM ((phase2endtime - phase2starttime) HOUR TO SECOND)) * 60 +
EXTRACT(SECOND FROM ((phase2endtime - phase2starttime) HOUR TO SECOND)) AS DEC (10,2)) AS Phase2ElapsedTime

/*phase3*/
, CAST ( EXTRACT(HOUR FROM ((phase3endtime - phase3starttime) HOUR TO SECOND)) * 3600 +
EXTRACT(MINUTE FROM ((phase3endtime - phase3starttime) HOUR TO SECOND)) * 60 +
EXTRACT(SECOND FROM ((phase3endtime - phase3starttime) HOUR TO SECOND)) AS DEC (10,2)) AS Phase3ElapsedTime

FROM  dbc.DBQLUtilityTbl;
Add columns to the SQL as per your requirements.
Refer to Roland’s articles on Fastload and Multiload utilities to proceed.
By utilizing the DBQLUtilityTbl data history, the subsequent graphs can be generated:
*Please note that this is simulated data, and it may or may not depict an accurate behavior of a system.*
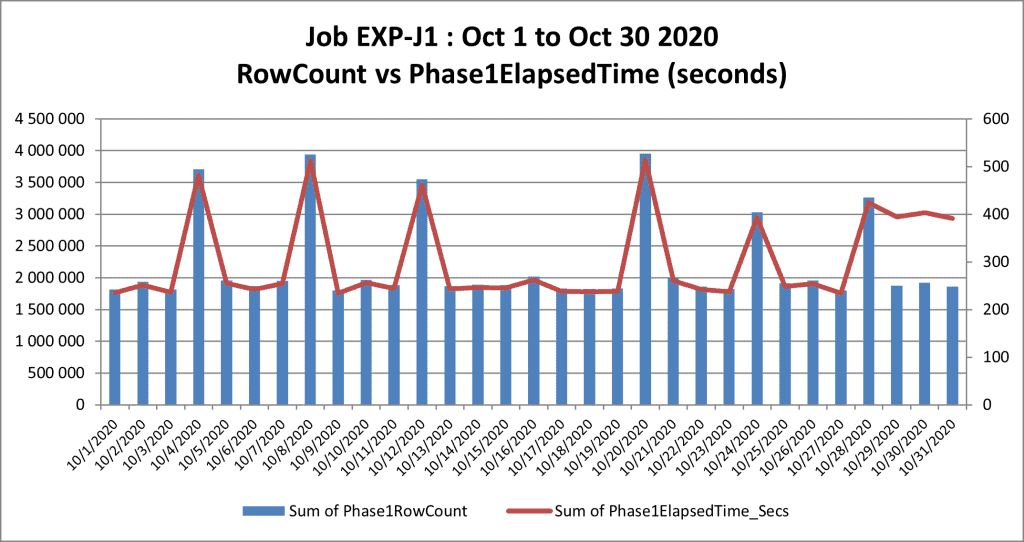
Graph 1: Data quantity versus load time from host to Teradata (Phase 1) for job EXP-J1.

The data loaded every fourth day is doubled, resulting in extended loading times.
Towards the end of October, specifically from the 29th to the 31st, the volume of data remains consistent, not exceeding 2 million rows, comparable to the typical daily average. Nonetheless, its duration to load remains considerably long, clocking in at approximately 400 seconds or roughly 6 minutes.
To understand this conduct, examine the activity of the Teradata system, which may be highly occupied. If nothing is unusual, investigate the host device transmitting the data, which may have a heavily occupied CPU and I/O, causing slower transfer rates. Additionally, consider the possibility of a congested network.
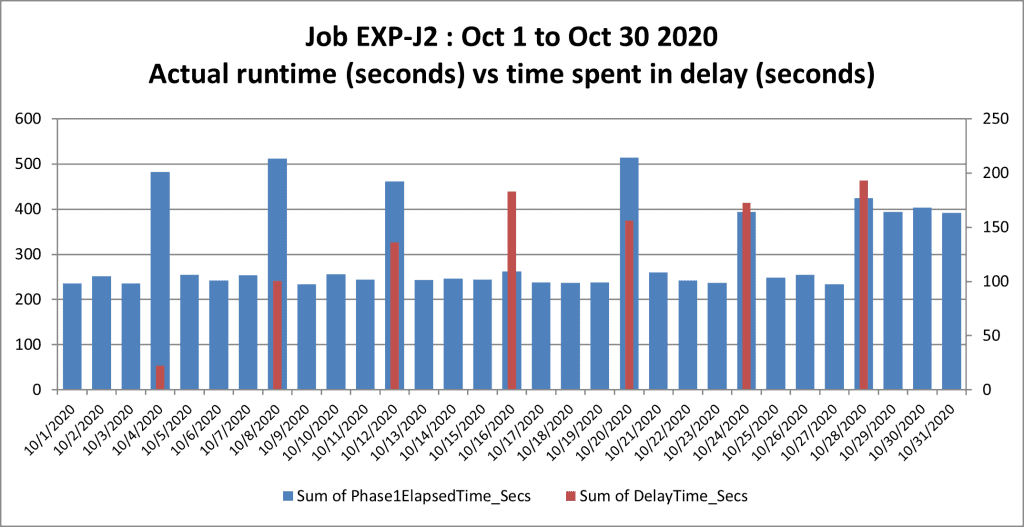
Graph 2: actual runtime vs. time spent in delay state

This graph pertains to the same context as the previous one: slow load times during month-end. However, it focuses on the duration of a particular task’s waiting time for a load slot, i.e., the delayed state.
The job experiences a delay every four days, possibly due to a larger number of TPT jobs running concurrently in the system. The duration of the delay state varies from a few seconds on October 4 to almost 200 seconds (just over 3 minutes) on October 16, 20, 24, and 28.
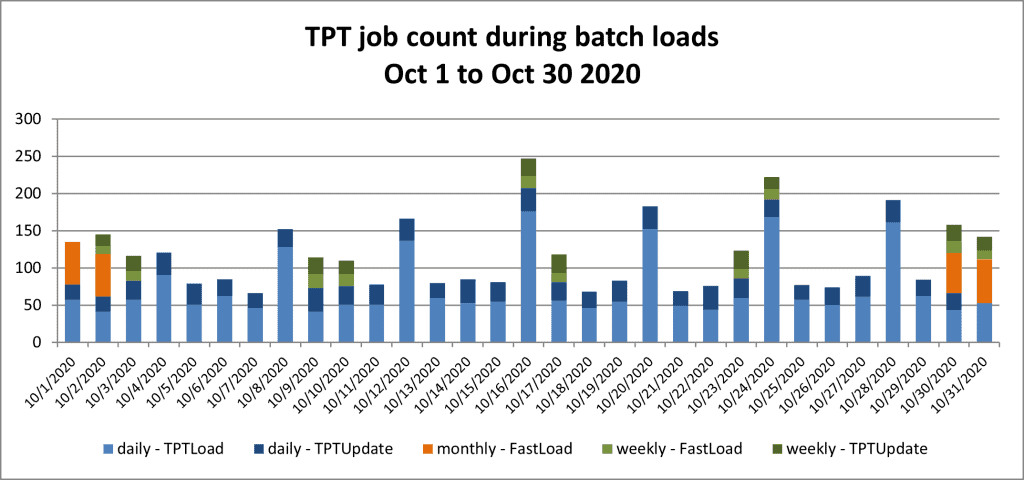
Graph 3: number of daily, weekly, and monthly jobs for a given time frame

It is intriguing to observe the frequency with which jobs are scheduled, whether monthly, weekly, or daily, and the type of utility used, whether fastload or multiload.
Correlating this graph with the previous analysis reveals that on Oct 16, 20, 24, and 28, when the job EXP-J2 experienced significant delays, a higher number of utilities were active. Specifically, there were more daily jobs utilizing the tpt load protocol.
These graphs provide a broad perspective of the situation. To achieve more detailed information, you must analyze data hourly or even minutely for greater precision.
I trust this article has furnished useful insights on the logging level and its benefits.
Feel free to comment with any questions or clarifications.


Hi Gerome,
Thanks for all the articles on DWHPRO.
I have a question on Utility Table:
Does the Utility table capture the actual rows inserted during an MLOAD/FLOAD job?
For several of my jobs, I see millions and millions of rows being inserted/updated and the job runtime is less than a minute or so.
When cross verified with DBQL – StmtDMLRowCount,
I see the same numbers.
But, my project/tables are so small and can’t understand if the data/logs are showing correct value.
(Do not have a contact to check with ETL Team/session logs).
Can you please let me know, How to verify or check the actual rows inserted/updated during an MLOAD/FLOAD job?
SQL:
Sel
Logdate, username, LSN,
,RowsInserted
,RowsUpdated
,RowsDeleted
,RowsExported
FROM PDCRINFO.DbqlUtilityTbl_hst
where username=’ETL_XYZ’
and LSN=’ ‘
AND LOGDATE=”;
Thank you!
Sravan