Missing statistics for indexed columns are typically inconsequential. The Optimizer replaces them with dynamic AMP-sampled statistics. Unless tables are significantly skewed, the sampled estimates should suffice to generate a satisfactory execution plan.
Omitting statistics for non-indexed WHERE condition columns will result in suboptimal workload performance.
This article explores Optimizer’s ineffective method for estimating the cardinality of non-indexed columns.
Teradata Heuristics – A Nasty Surprise
In the absence of statistics on non-indexed WHERE condition columns, the Optimizer can resort to a basic estimation method based on the row count:
Combining WHERE conditions with AND applies the following formula:
SELECT * FROM The_Table
WHERE
first_column = ‘A’ — 10% of the table cardinality
AND second_column = ‘B’ — 75% of above estimation
AND third_column =’ C’ — 75% of the previous estimation
…
AND nth column = ‘X’; — 75% of the estimation of column n-1
The estimation is: ((estimated number of rows in table) * 0,1) * ( 0,75 * 0,75 * … * 0,75) rows
The formula will below be applied if the WHERE conditions are combined using OR.
SELECT * FROM The_Table
WHERE
first_column = ‘A’ — 10% of the table cardinality
OR second_column = ‘B’ — 10% of the table cardinality
OR third_column =’C’ — 10% of the table cardinality
…
OR nth column = ‘X’; — 10% of the table cardinality
The estimation is: (estimated number of rows in the table) * 0.1 * n
The collected or random-AMP statistics for the primary index determine the table’s cardinality.
Heuristics can be unexpectedly problematic.
[su_panel shadow=”8px 1px 2px #eeeeee”]It makes no difference if your query selects millions of rows or no row at all: the estimations are stupid and most times either too high or too low.[/su_panel]A brief comment is necessary regarding the estimation of columns joined with OR.
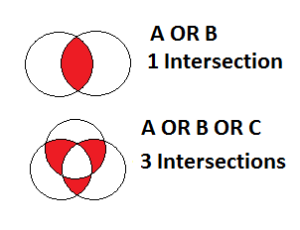
Teradata 14.10 implements the aforementioned rule. In prior releases of Teradata, the reduction of the above estimates is at a rate of 1% for each intersection in set theory, including:
A OR B: 1 intersection, the estimation is decreased by 1%
A OR B OR C: 3 intersections, the estimation is decreased by 3%
Altogether: Heuristics are a bad way to estimate the cardinality of retrieve steps.
The Optimizer’s Toolkit to Improve Estimations
Fortunately, the Optimizer can utilize supplementary information to enhance estimations for non-indexed WHERE condition columns.
Accessing a column with gathered statistics in the WHERE clause will utilize its estimation as a starting point rather than relying on the imprecise 10% rule. The heuristic approach will still be employed for the remaining columns.
COLLECT STATISTICS ON The_Table COLUMN first_column;Based on the statistics in first_column, we assume that there will be 5,000 rows.
SELECT * FROM The_Table
WHERE
first_column = ‘A’                  -- 5,000
AND second_column = ‘B’   -- 75% of above estimation
The estimate is 3,750 rows.
The example illustrates how the Optimizer utilizes statistics to enhance the initial estimation point for subsequent calculations.
What occurs when we gather statistics for both the first_column and second_column?
The Optimizer selects the column with the highest selectivity as a starting point for this case. It applies the usual heuristics to the second column without considering its collected statistics.
COLLECT STATISTICS ON The_Table COLUMN first_column; - 5,000 rows with value ‘A’COLLECT STATISTICS ON The_Table COLUMN second_column; - 200 rows with value ‘B’
SELECT * FROM The_Table
WHERE
first_column = ‘A’ -- 75% of below estimation
AND second_column = ‘B’ -- 200 rowsEstimated row count: 150.
The Twisted World of the Optimizer: How Skew Improves the Estimations
The Optimizer utilizes the skew information regarding the first_column column to improve the estimation accuracy.
The Optimizer applies the “skew rule,” which dictates the following.
Suppose the column “first_column” appears in over 75% of the rows due to biased values in the statistics histogram. In that case, the estimation of 75% will be substituted with the actual occurrence of the skewed value, resulting in a more accurate estimation.
As previously mentioned, we assume that 90% of rows in the first column have the value ‘A’, resulting in a skewed distribution. To analyze this bias, we can utilize histograms designed for such values.
COLLECT STATISTICS ON The_Table COLUMN first_column; - 5,000 rows with value ‘A’COLLECT STATISTICS ON The_Table COLUMN second_column; - 200 rows with value ‘B’
SELECT * FROM The_Table
WHERE
first_column = ‘A’ -- 90% of below estimation
AND second_column = ‘B’ -- 200 rowsEstimated number of rows: 180.
Utilizing biased value information enhances estimations.
To improve estimations beyond utilizing only one WHERE condition column, consider exploring alternative methods for optimization.
Multi-column statistics provide the solution.
COLLECT STATISTICS ON The_Table COLUMN (first_column,second_column);
SELECT * FROM The_Table
WHERE
first_column = ‘A’
AND second_column = ‘B’;
The Optimizer no longer relies on heuristics thanks to the inclusion of multi-column statistics.
Another reason to avoid heuristics is their potential drawbacks.
Suppose heuristics are used to estimate the cardinality of at least one column. In that case, the retrieval process will result in “no confidence” and limit the potential optimizations available to the Optimizer, creating a conservative execution plan.
I hope you enjoyed the content, and do not hesitate to ask for clarification or additional information.


Hi Akilan, especially for you. My new article covering this topic:
https://www.dwhpro.com/teradata-multi-column-statistics/
Hi –
It’s good stuff. Kindly clarify the below one,
Multi-column stats are defined and a few columns are part of the SQL. How the estimation will happen there?
COLLECT STATISTICS ON The_Table COLUMN (first_column,second_column);
SELECT * FROM The_Table
WHERE
first_column = ‘A’;
Thanks
This is an awesome explanation.
Very good explanation, thank you!