The DBC.ResUsageSAWT table serves as our main tool for analyzing workload flow control states. To provide an overview, we will outline the main characteristics of this table.
The table displays several measures that reflect the state at the conclusion of a 10-minute interval. It’s important to note that the allotted interval may diverge from that of your system if the database administrator altered it. The “secs” column specifies the predetermined duration of the interval in seconds. In our instance, it spans 600 seconds (i.e., 10 minutes).
Each row in the data represents a specific Date and Time, occurring every 10 minutes, along with the corresponding Node and AMP information.
Allow me to provide a brief overview of the vital columns and their contents:
TheDate: The snapshot date.
TheTime: Represents the time when the snapshot was taken.
TheDate and TheTime display the status of AMP worker tasks at the end of each 10-minute interval.
Secs: Defines the duration of a snapshot interval
VPRID: Identifies the AMP
MailBoxDepth: This shows the number of messages in the AMP queue at the end of the snapshot interval.
If no AMP worker task is available to take over additional work, the task will be queued and appear in MailBoxDepth.
FlowControlled: This shows if the AMP is in a flow control state at the end of the snapshot interval.
FlowCtlCnt: This shows the number of times the AMP entered the flow control state during the snapshot interval.
InUseMax: This shows the maximum number of AMP worker tasks that have been active simultaneously during the snapshot interval.
Available: This shows the number of free AMP worker tasks at the end of the snapshot interval.
AvailableMin: Shows the minimum number of free AMP worker tasks during the snapshot interval.
AWTLimit: This shows the number of total AWTs in the system.
WorkTypeMax00, …, WorkTypeMax15: Shows the maximum number of AMP worker tasks per work type during the snapshot interval.
I renamed the columns better to understand the type of workload each column presents.
Although a few extra columns exist, they are typically irrelevant to our objective.
Certain columns displayed are exclusive to Teradata 14.10 or newer versions, and their population may differ prior to version 14.10.
Our test scenario involves analyzing the most severe flow control situation within DBC.ResUsageSAWT. Specifically, we will closely examine the AMP that experienced the lengthiest duration of flow control on a given day.
SELECT
TheDate
,TheTime
,Secs
,VPRID as TheAMP
,MailBoxDepth
,FlowCOntrolled
,FlowCtlCnt
,InUseMax
,Available
,AvailableMin
,AWTLimit
,WorkTypeMax00 AS DispatcherStep
,WorkTypeMax01 AS Spawned_Level1
,WorkTypeMax02 AS Spawned_Level2
,WorkTypeMax03 AS InternalWork
,WorkTypeMax04 AS Recovery
,WorkTypeMax08 AS ExpeditedDispatcherStep
,WorkTypeMax09 AS ExpeditedSpawned_Level1
,WorkTypeMax10 AS ExpeditedSpawned_Level2
,WorkTypeMax12 AS AbortStep
,WorkTypeMax13 AS SpawnedWorkAbort
,WorkTypeMax14 AS UrgentInternalWork
,WorkTypeMax15 AS MostUrgentInterbalWork
FROM DBC.ResUsageSAWT
WHERE (TheDate,NodeId,VPRID) IN
(SELECT TheDate,NodeId,VPRID FROM DBC.ResUsageSAWT
WHERE FlowCtlTime = (SELECT MAX(FlowCtlTime) FROM DBC.ResUsageSAWT )
);

The most critical measure is "InUseMax", which gives a clear picture of the system load. Although it is not distinguishing between different types of work, it is the only measure capable of showing us the maximum number of AMP worker tasks in use during the considered snapshot interval.
It is impossible to summarize WorkTypeMax00 to WorkTypeMax15 as the maximum numbers are gathered independently in each logging interval. While these columns can be utilized to analyze the behavior of a specific workload type, such as abort steps, they cannot accurately represent the overall system load.
Checking the InUseMax measure indicates the AMP worker task consumption by the total system workload, thereby reflecting the system’s load. It is important to note that the InUseMax value will always be less than or equal to the AWTLimit.
In addition to the measure InUseMax, which only displays the top usage of AMP worker tasks, we have two supplementary measures, Available and AvailableMin, that provide a more comprehensive overview.
Both measures can analyze events throughout and at the conclusion of the snapshot period.
“Available” indicates the quantity of unutilized AMP worker tasks following the snapshot interval. If “Available” remains at 0 for a series of successive snapshots, it indicates that your system has exhausted its AMP worker task supply over an extended period.
The column “AvailableMin” provides further information, indicating the minimum number of available AMP worker tasks within the snapshot interval.
If Available and AvailableMin reach 0 in consecutive snapshots, it indicates that the system is fully loaded during that time. In addition to the AMP worker task utilization measures, we also have measures that pertain to flow control, including MailBoxDepth, FlowControlled, FlowCtlCnt, and FlowCtlTime.
High usage of AWT does not automatically indicate the system is in flow control. The system enters a flow control state when all AMP worker tasks are occupied and the message queues are full. Although the mailbox depth is generally above zero during a flow control state, it is not always accurate because it only displays the message queue size at the conclusion of each snapshot interval. It is possible that the AMP was in a flow control state during the snapshot interval, but the queue was empty by the end. This should be considered.
FlowControlled indicates the AMP’s flow control status at the end of a snapshot interval but does not necessarily reflect its status throughout the interval. Thus, relying solely on this measure can be misleading.
FlowCtlCnt indicates how often the AMP entered the flow control state during the snapshot interval.
FlowCtlTime is the total time the AMP was in flow control during the snapshot interval (in milliseconds)
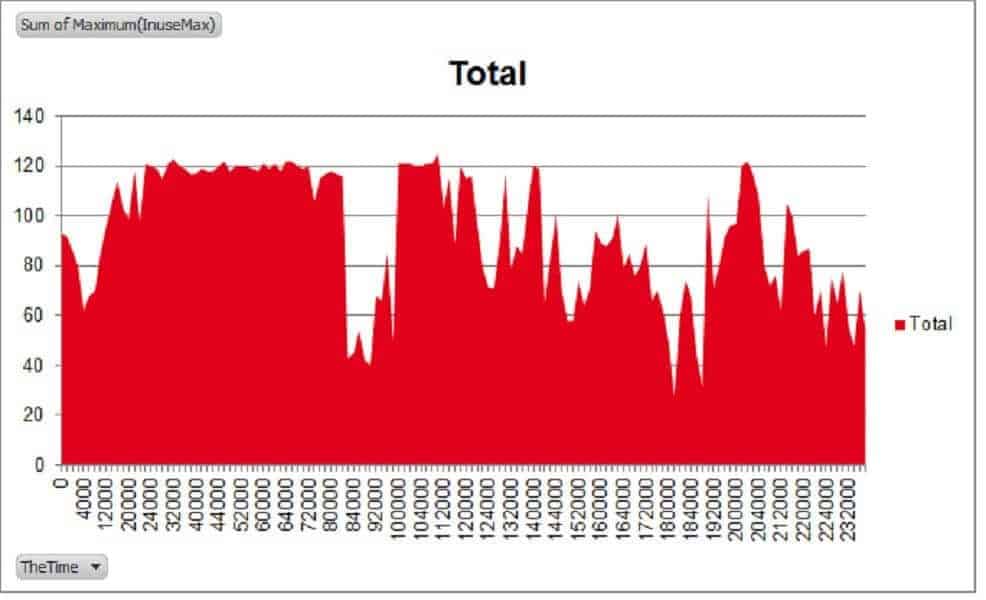
Combining the aforementioned metric will provide valuable insight into your system’s workload. Adding up the MaxInUse column yields a comprehensive overview of the system’s load, serving as a solid foundation for delving deeper into the specifics.
The system allows for a maximum of 120 AWTs per AMP, with a default limit of 80.

Awesome post.. Thank you
Thank you
Hi Roland,
Very nice summary, straight to the point.
There are 2 typos though, that can be a bit misleading:
– “Available shows the number of AMP worker tasks in use at the end of the snapshot interval.”
It’s rather: “Available shows the number of AMP worker tasks available at the end of the snapshot interval.”.
– “… AvailableMin, which is measuring the minimum number of AMP worker tasks having been used at one point in time during the snapshot interval.”
It’s rather: “… AvailableMin, which is measuring the minimum number of AMP worker tasks having been available at one point…”
You might want to correct that.
Hi Tomas,
Thank you very much. I corrected it.